| Overview | Science Cases | Simulations | Filters/Gratings | Team | IRIS ETC |
IRIS Simulations
These simulations are generated by using the advanced IRIS sensitivity and simulator code (Wright et. 2014, Do et al. 2014). The IRIS sensitivity code consists of a set of routines for calculating the expected observed signal-to-noise ratio given the expected performance of the AO system, instrument, with a realistic estimate of the noise and background on Mauna Kea. The code can currently produce simulated point sources as well as extended sources for both the IRIS imager and integral field spectrograph. If you are interested in using the code or have something you wish to simulate, please get in touch with the IRIS team!
Simulated imager performance of JWST's NIRCam (LEFT) compared with the OSIRIS imager (MIDDLE) and the IRIS imager performance (RIGHT), utilizing the central arcsecond of the galactic center to illustrate angular resolution differences between instruments.
Keck AO/NIRC2 simulation image (LEFT) compared to simulated IRIS image (MIDDLE) of Io. Both Simulations made use of the Galileo Solid-State imaging camera data set (RIGHT). IRIS will be able to resolve structure on the Io surface down to ~12 km using the 4 mas plate scale of the imager and IFS. This unprecedented resolution will allow the ability to image and monitor volcanic activity on Io’s that typically occur on 40-200 km sizes. See Wright et al. (2016).
Simulated IRIS three color (J, H, and K) image of Pluto and Charon, with a single 100 second integration time. In comparison, HST observations only a sample ~10s pixels across Pluto and need to perform extensive deconvolution routines on multiple phases of observations. In this single observation, the IRIS imager at the 4 mas scale will resolve a spatial scale of ~82 km on both Pluto and Charon. See Wright et al. (2016).
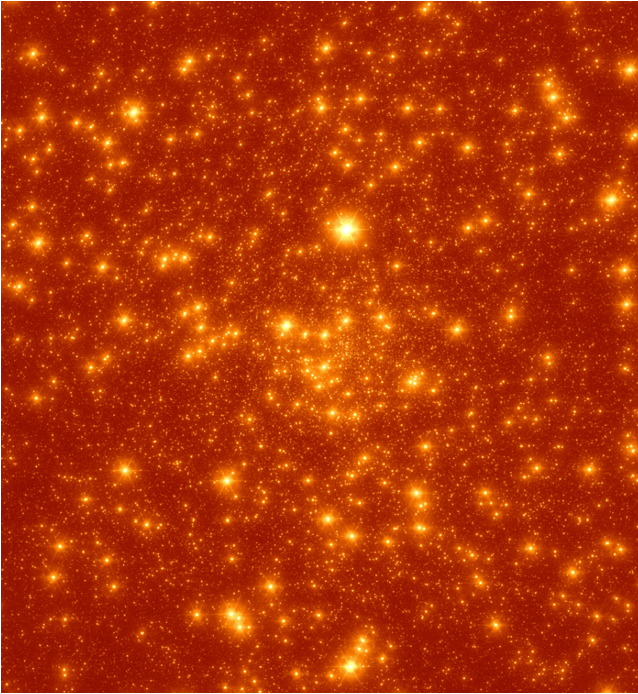
Simulation of an IRIS imager observation using K (2.2 μm) broadband of the Galactic Center with the expanded field of view of 32.8" x 32.8". In a single shot using the 0.004" plate scale the IRIS imager will be able to capture the inner-arcsecond sources, Sgr A*, the extended stellar population, and essential astrometric reference frame sources of 8 masers. This simulated observation represents only 20 seconds of exposure time. Based on the extrapolated stellar population IRIS would be able to detect 500,000 stars down to K < 25 mags.
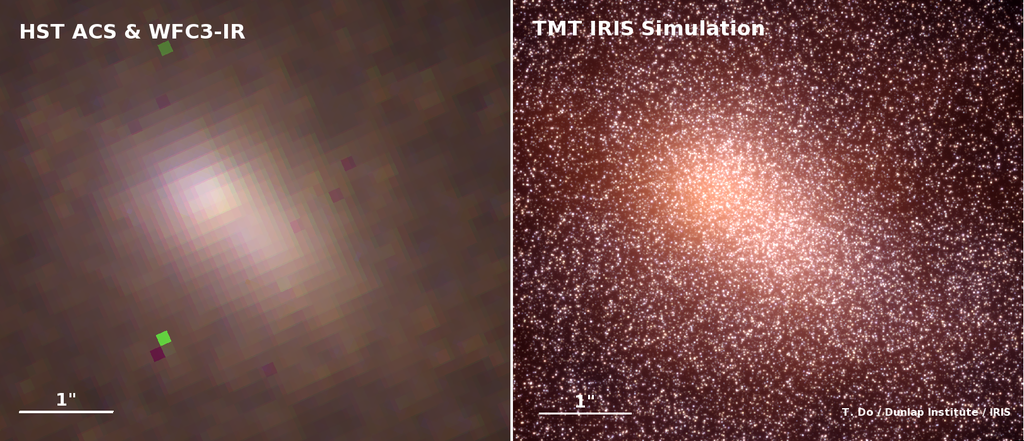
TMT will be a revolutionary instrument that will be able to resolve individual stars at the center of Andromeda. On the left shows a three color image of the current capabilities using HST ACS (F814W) and WFC3 (F110W, F160W). On the right a three color image (Z, J, and K bands) using TMT's first light instrument IRIS with the NFIRAOS adaptive optics system. TMT and IRIS will provide the necessary sensitivity and spatial resolution for understanding the dynamics, stellar population, and supermassive black hole at M31's center.
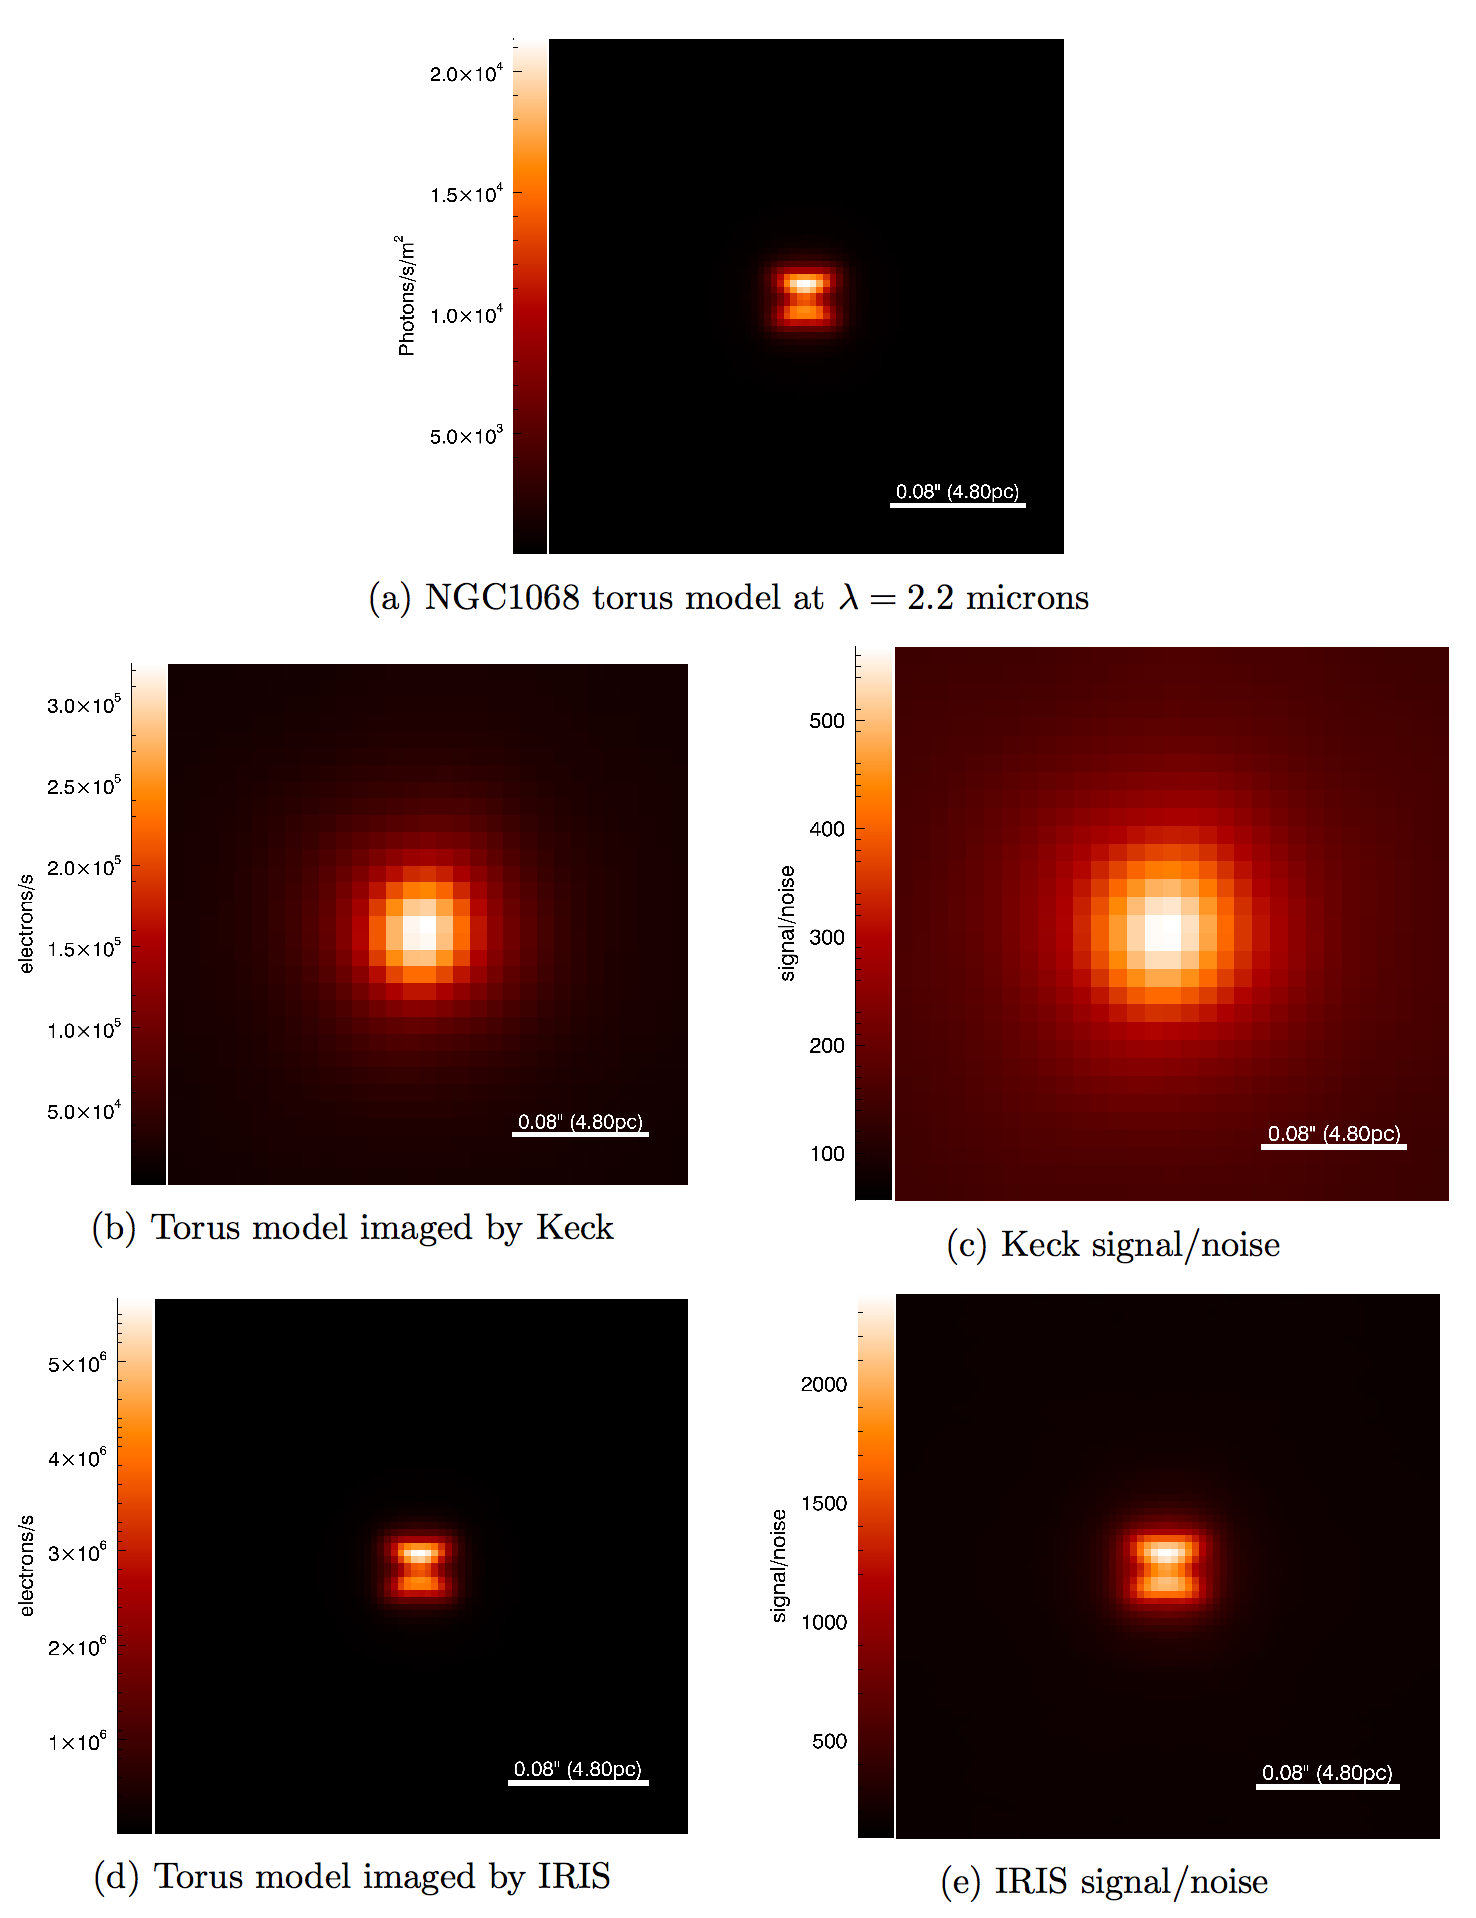
TMT/IRIS will be able to image the tori of nearby active galactic nuclei (AGN). (a) Model of NGC1068's torus region (λ = 2.2 microns, 0.004" per pixel), an archetypal Type II Seyfert galaxy (E. Lopez-Rodriguez et al. 2014). (b) Simulated Keck observation (K band, 0.01" per pixel, 1 second exposure) of the model with the corresponding SNR shown in (c). (d) Simulated IRIS observation (K band, 0.004" per pixel, 1 second exposure) of the model with the corresponding SNR shown in (e). The IRIS simulated images clearly resolve the structure and orientation of the simulated torus, something that is not currently possible given the Keck simulations. See Wright et al. (2016).
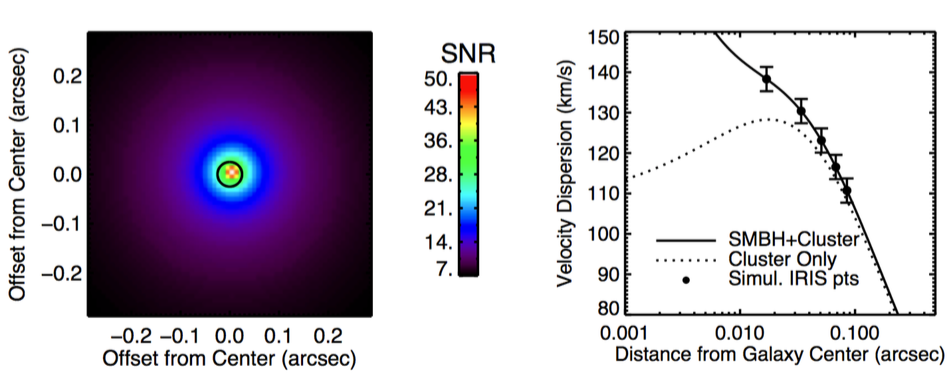
TMT/IRIS will have the capability to accurately measure supermassive black hole (SMBH) masses at all cosmic scales, and nearby lower mass SMBHs. (LEFT) Simulation of the SNR of observations of the extinction corrected core of the Milky Way if it were at the distance to the Virgo Cluster (~16 Mpc), at K band with 10 observations of 900 s each, at R = 4000 in the 9 mas plate scale. The black circle is the marks the radius of influence of a 4 × 10⁶ M☉ BH. (RIGHT) The velocity dispersion curve of the nuclear star cluster with a 4 × 10⁶ M☉ black hole and a star cluster with ~1 × 10⁶ M☉ within the central 1 pc (solid line). The dashed line shows the velocity dispersion profile for the cluster alone. The innermost measurements from IRIS will be able to sample the Keplerian falloff the in velocity dispersion profile. See Do et al. (2014)
Simulations of a field within a spiral galaxy in the Virgo Cluster. The field contains an old, metal-rich population in an area with a surface brightness of 22 mag arcsec-2, assuming a total exposure time for 3 hours in K. The left hand panel shows the field as it would appear if viewed with the Keck AO system, while the right hand panel shows the field as it would appear if viewed by IRIS+NFIRAOS. Only the very brightest asymptotic giant branch (AGB)-tip stars are detected in the Keck image. However, stars that are fainter than the red giant branch (RGB) tip are detected with TMT. The detection of stars on the AGB and the upper portions of the RGB will allow the age and chemical evolution of Virgo galaxies to be probed in a direct manner.
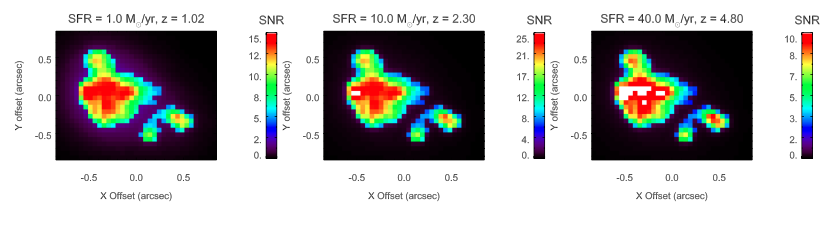
The signal-to-noise ratio (SNR) from simulated IRIS integral field spectrograph observations of a galaxy at three redshifts. All three simulations consist of 12 x 900 second frames in the 0.05" spatial scale. (LEFT) Simulated galaxy at z=1.02 with a total integrated star formation rate of 1 M☉ yr-1. The SNR is derived from Hα redshifted into the J-band. (MIDDLE) Simulated galaxy at z=2.3 galaxy with a total integrated star formation rate of 10 M☉ yr-1. The SNR is derived from Hα redshifted into the K-band. (RIGHT) Simulated galaxy at z=4.8 galaxy with an integrated star formation rate 40 M☉ yr-1. The SNR is derived from [OII] 372.7 nm redshifted into K- band.
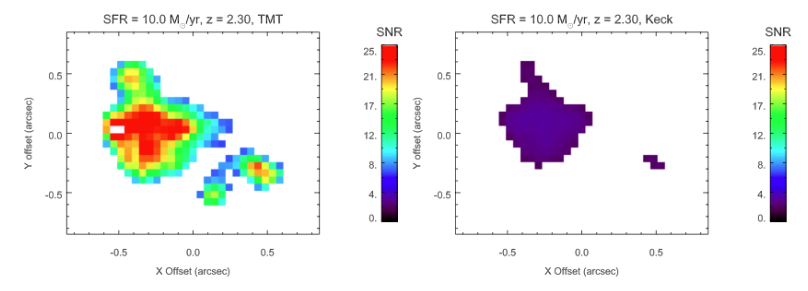
A simulated z = 2.3 galaxy, with Hα redshifted to K-band and an integrated star formation rate of 10 M☉ yr-1 (LEFT). This is compared to Keck observations of the same simulated galaxy (RIGHT) using the same spatial sampling of 0.05" per spaxel. Both simulations were for a R=4000 IFS with a 2 hour (8x900s) integration in K-band. Complex structure with multiple knots can be seen with IRIS and TMT, while only the brightest portion of the galaxy is barely detectable (SNR~3) with Keck. The higher SNRs for IRIS are also essential for detecting other emission lines, like [NII], [OIII], [SII], for diagnostics of their ionization parameters and chemical abundances. The finest spatial scale of 0.004" and 0.009" will be able to probe down to individual giant molecular cloud regions in this galaxy. See Wright et al. (2014).
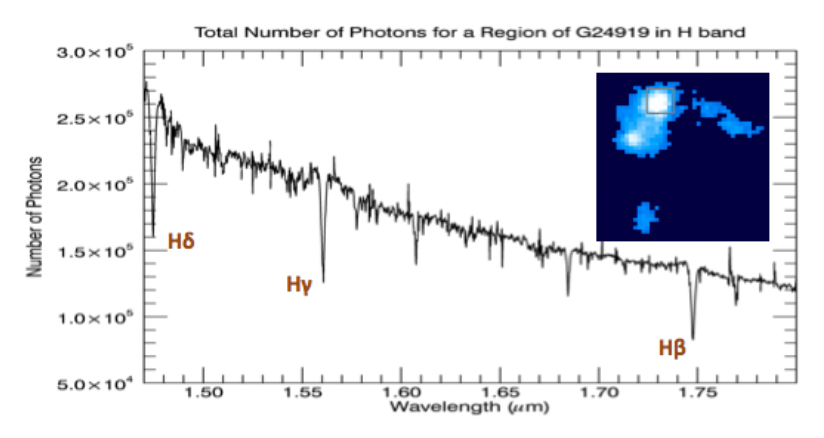
Resolved spectroscopy of a 900 Myr stellar population in a z=2.6 galaxy. The thumbnail is 2"x2" region of a simulated galaxy using the IFS 50mas scale at H-band. The integrated spectrum is shown as the collapsed box region on the galaxy.
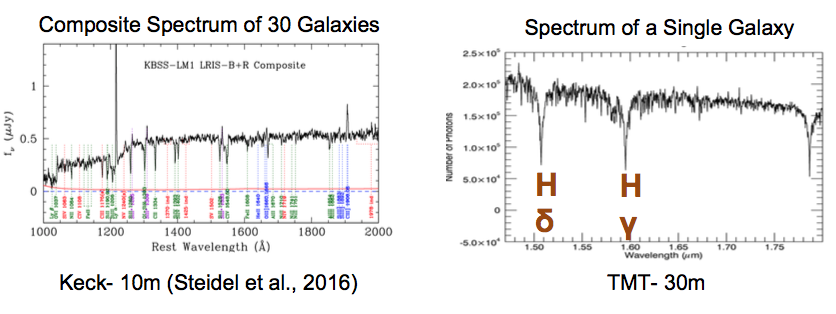
A comparison of the sensitivity between Keck MOSFIRE stacked spectra of z=2 galaxies (LEFT) versus an IRIS IFS integrated spectrum of a single z=2.6 galaxy. Note that you can easily resolve weaker absorption transition in the Balmer series from the underlying stellar population. IRIS will be able to conduct spatially resolved studies of the stellar population in distant galaxies.
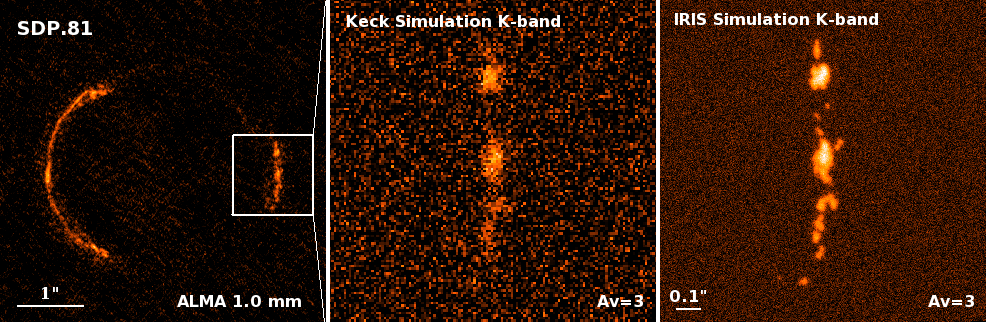
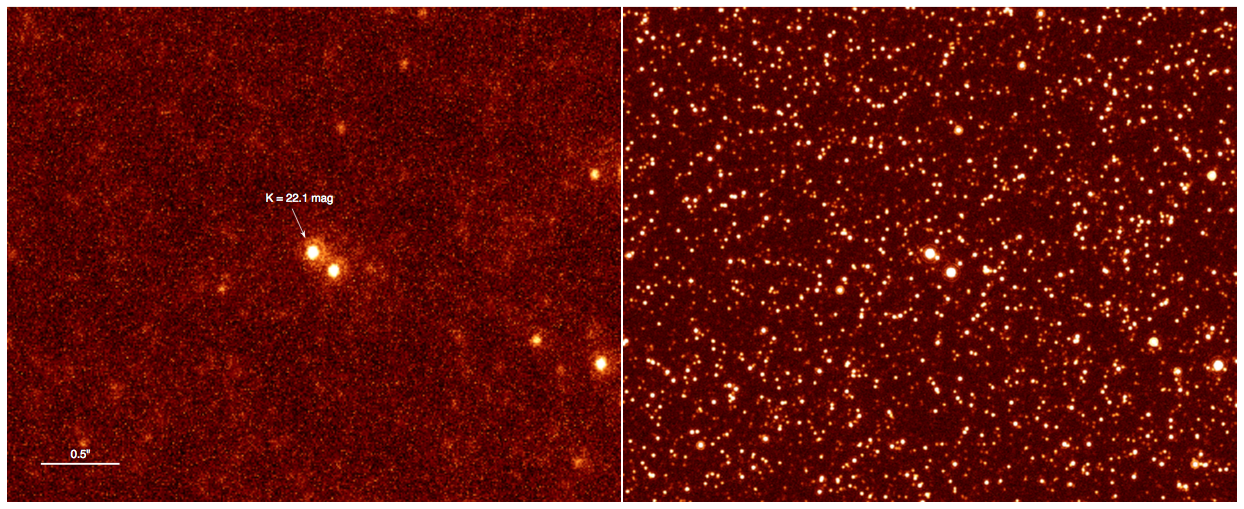
IRIS simulation of a distant strong gravitationally-lensed galaxy. (LEFT) Original ALMA 1.0 mm image of the gravitationally-lensed galaxy SDP.81 at z=3.042 with 23 mas resolution used for Keck/NIRC2 and TMT/IRIS simulations. (MIDDLE) A zoom-in of Keck/NIRC2 K-band simulated image of the arc assuming that the stellar continuum is attenuated by a Calzetti dust law with an AV=3. (RIGHT) IRIS imager K-band simulation using the same parameters as Keck/NIRC2. The 23 mas structures are clearly resolved with IRIS, and at the highest spatial resolution it will be able to resolve structures ~5× smaller than ALMA. Both simulations were performed with the same total integration time of 8 hours for a direct comparison.
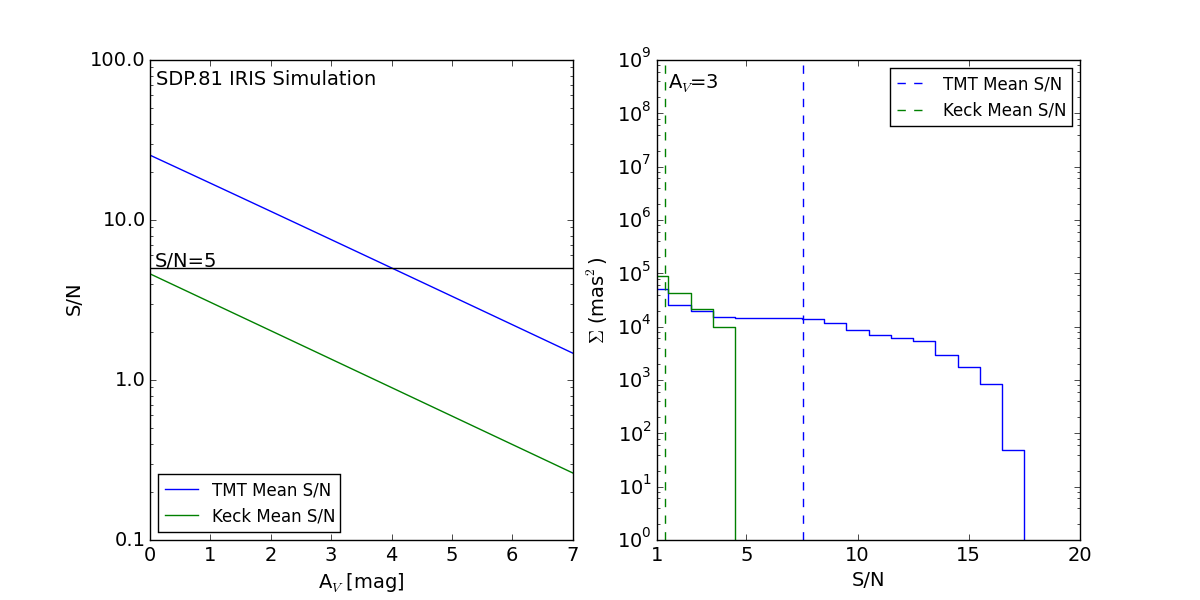
Signal-to-noise comparison between Keck/NIRC2 and TMT/IRIS from the simulation in figure above. (LEFT) S/N of the simulations for a given AV. IRIS+TMT will be able to perform essential imaging studies of heavily obscured (AV=4) high-redshift galaxies. (RIGHT) Number of pixels above a certain SNR at a dust obscuration of AV=3. The median SNR for IRIS+TMT is about 7, whereas with Keck the maximum well below 2. TMT+IRIS will be able to resolve the stellar continuum in these dusty galaxies over lower surface brightness features with significant spatial coverage. See Wright et al. (2016).
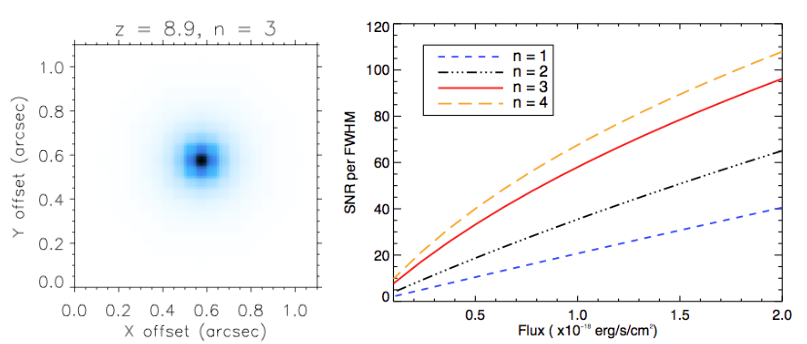
We investigated IFS sensitivities of Lyα emission from young distant galaxies with varying surface brightness profiles and redshifts (6 < z < 12). Using the measured half light radius of first light galaxies, between 0.4 – 0.8 kpc (Oesch et al. 2010), we explored a range of Sersic profiles and the SNR per FWHM versus the total Lyα flux of the galaxy51. (LEFT) We present a simulated image of a z=8.9 galaxy with Lyα of n=3 Sersic index with normalized flux with a half-light radius of 0.6 kpc. (RIGHT) A range of Sersic profiles with their corresponding SNR per FWHM is presented for the same galaxy. This is using the 0.05" IFS plate scale at R=4000 with a Lyα velocity dispersion of 25 km s-1 observed for a total of 5 hours (20 × 900s) in H-band. See Wright et al. (2014).