| Overview | Science Cases | Simulations | Team |
Liger Simulations
These are simulations conducted by the OIR Lab using estimates of the point spread functions of the upcomcing Keck All-sky Precision AO (KAPA) system, Liger performance, and the atmospheric conditions of the summit of Mauna Kea. Here we show some of the performance simulations conducted for Liger, Science simulations are illustrated in the Science Cases section.
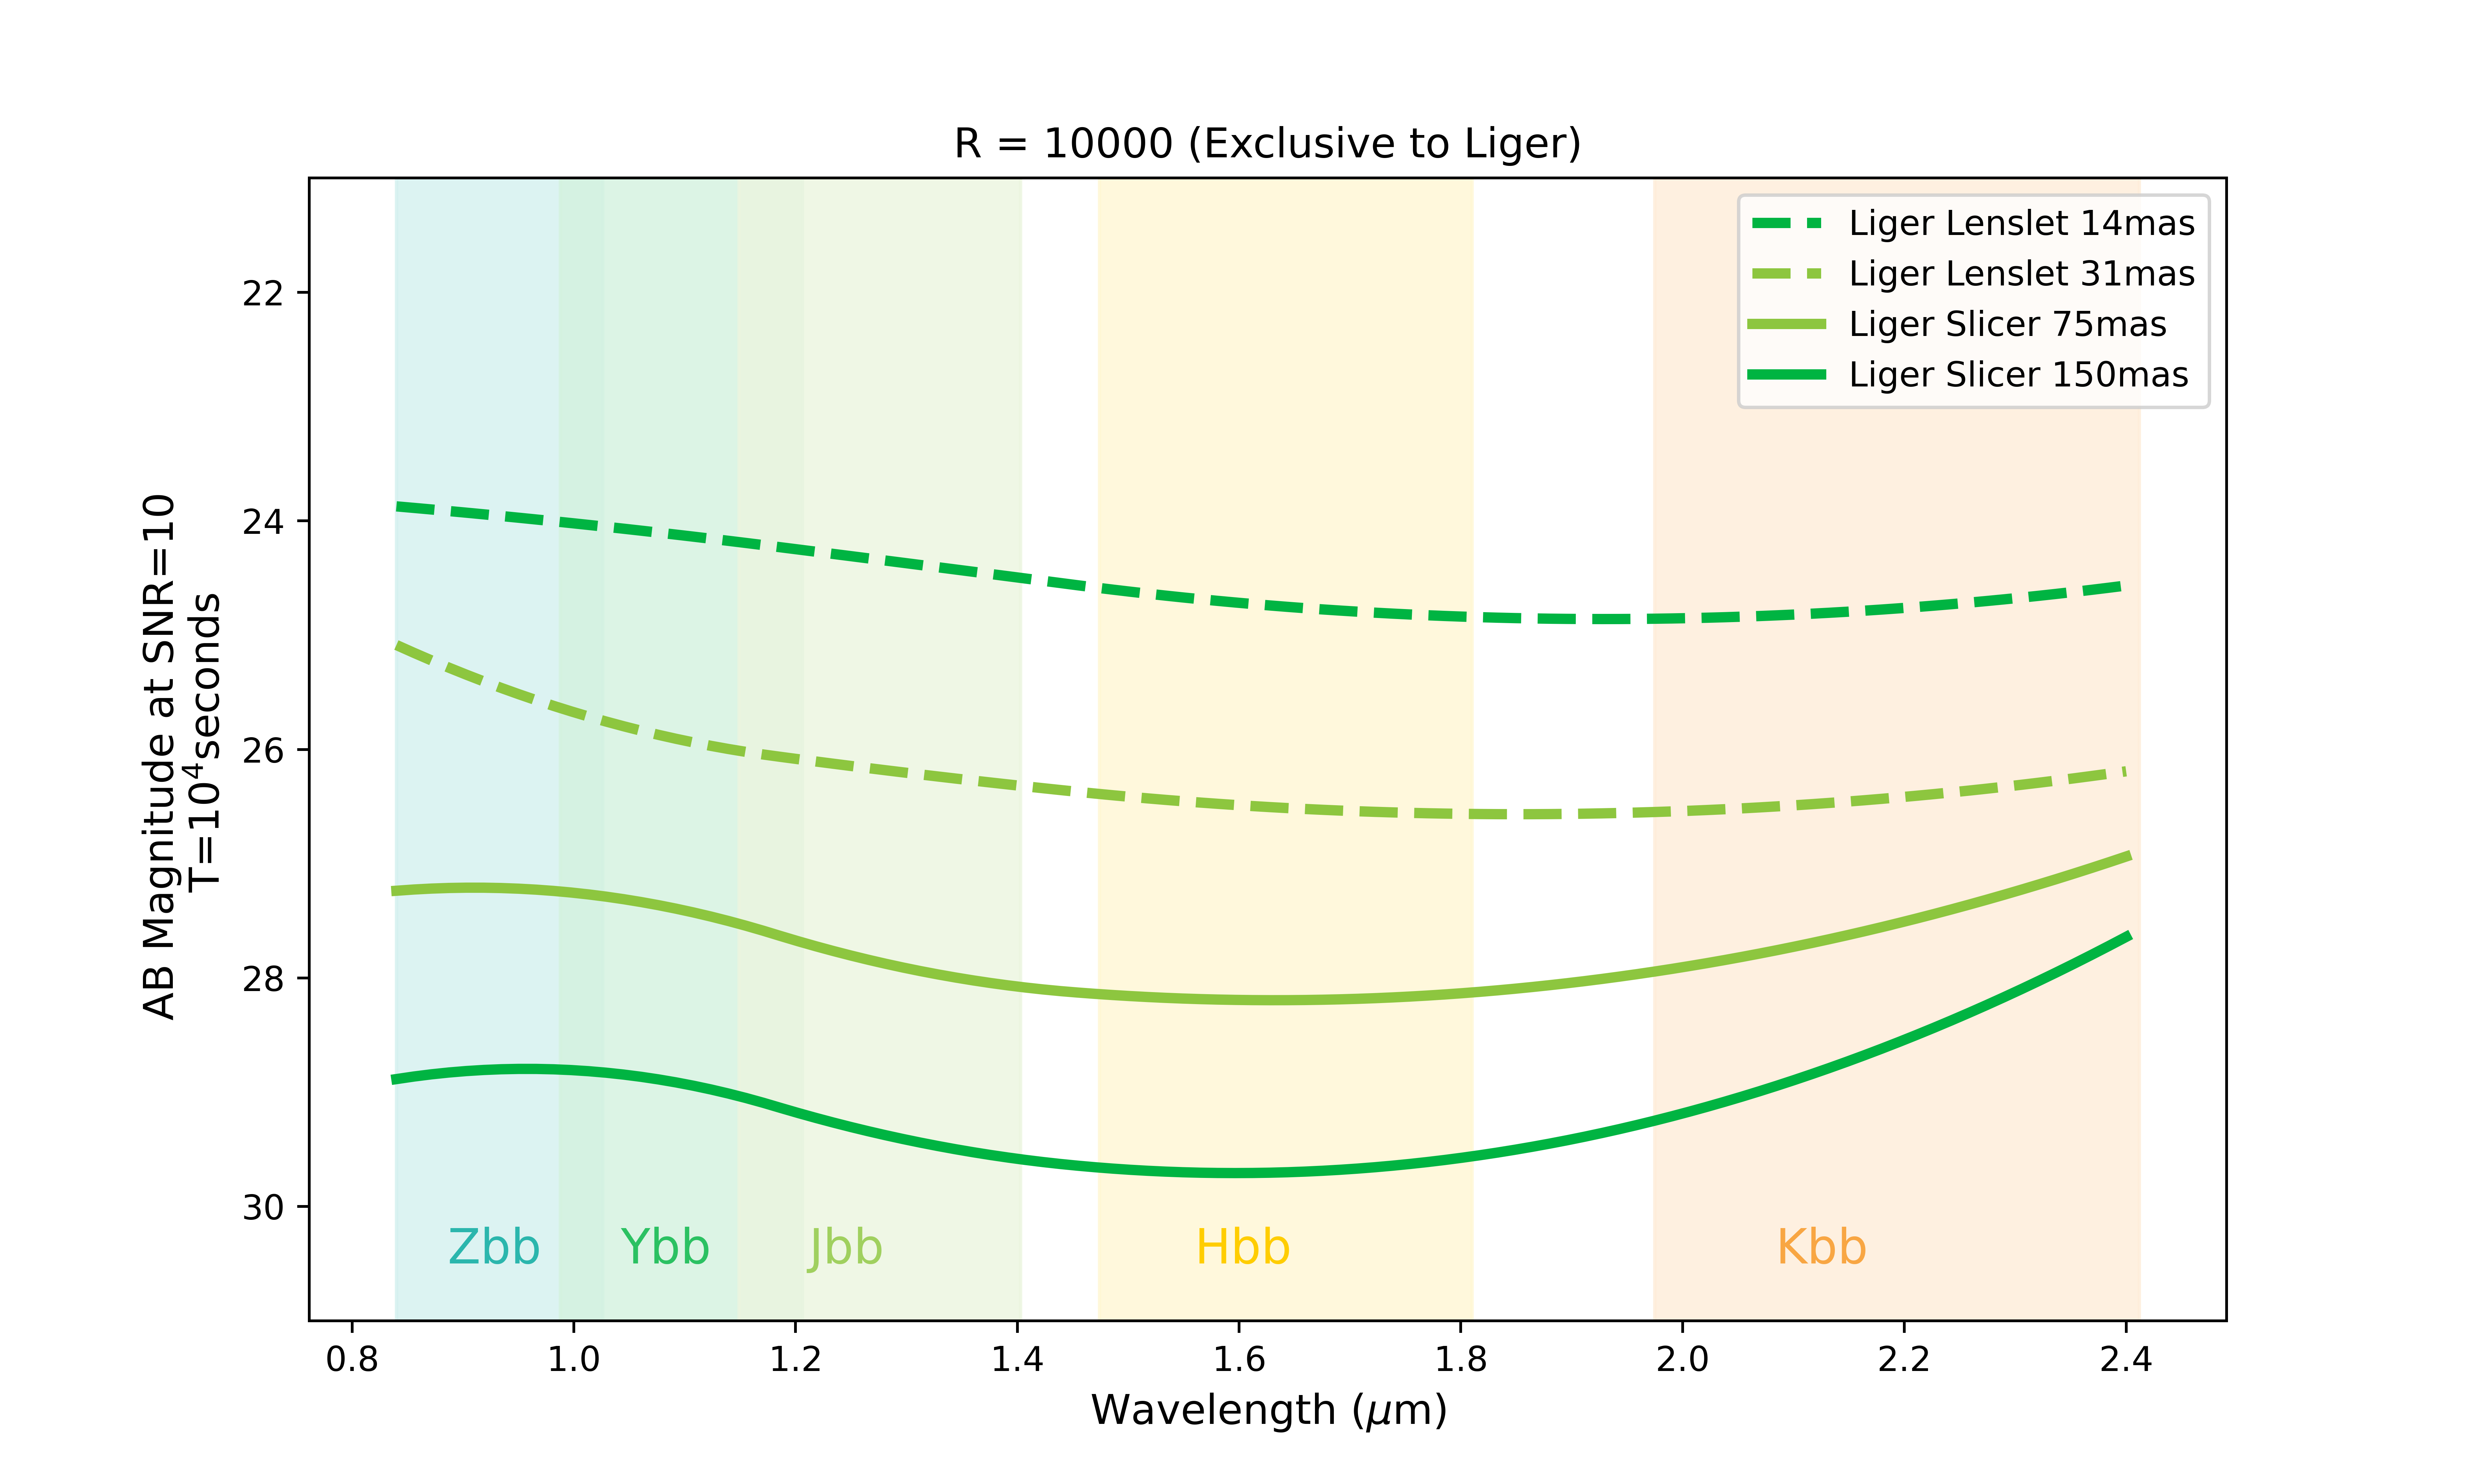
Estimated sensitivity in source brightness at which SNR=10 is achieved in an integration time of 104 seconds for various near-infrared competing instruments from world-wide observatories as compared to Liger. The solid lines indicate Liger’s performance, dashed lines indicate existing instruments, and dotted lines indicate upcoming future instruments. The spatial scales (in terms of miliarcseconds per spatial pixel) are listed for each instrument, at fine plate scales (left) and coarser plate scales (right). Liger achieves the finest plate scale at 14 miliarcseconds per spatial pixel. Instrumental filter modes, shown in the shaded regions for each plot, illustrate that Liger provides the widest wavelength range of any competing instrument, and offers the highest performance in sensitivity, with exception of JWST in the coarse scale.

Of the competing integral field spectrographs in the near-infrared range, Liger is the only instrument to offer an observing mode capable of a spectral resolution of R~10000. The mode provides sensitivity gain across plate scales and wavelength, and increases the instrument’s capability of distinguishing OH-sky line emission, which is essential for the scientific capability for any ground-based near-infrared instrument. Sensitivity units are consistent with the figure above and illustrate the extraordinary capability of Liger to achieve high spatial and spectral resolution at exceptional sensitivity.
The Liger imager and pick-off mirrors have been designed to optimize optical performance and preserves the fidelity of the WMKO AO performance. The root-mean-square (rms) wavefront error (nm) is shown for the imager field, lenslet pick-off, and slicer pick-off mirrors.
-1.jpg)
Simulation of the Liger Slicer spectral distribution across the IFS detector (Left, Middle) and a 2D image slice of the reduced data cube following the reduction of the raw detector data (Right) using the 150mas mode and the Kbb filter. Utilizing high sensitivity and a larger FOV, a large number and contrast of sources are captured in the Liger slicer’s scope of scientific capability. This field consists of source brightness down to 23rd magnitude (Vega) over 20 sources, and Liger performance was simulated with an integration time of 1 hour and 15 minutes.
-1.jpg)
Simulation of the Liger Lenslet spectral distribution across the IFS detector (Left, Middle) and a 2D image slice of the reduced data cube following the reduction of the raw detector data (Right). The lenslet spectrograph breaks up the pixels of the image and produces a spectrum for each pixel. The middle panel shows a raw exposure with 16,000 simulated spectra interleaved on the detector. When extracted with the data reduction pipeline, this creates a data cube (right) with 500 independent spectra channels.
